Government Grants and Contracts for Nonprofits: A Look at Arizona
Last year, The Center on Nonprofits and Philanthropy at The Urban Institute surveyed nonprofits across the United States about trends and impacts of government grants and contracts. In 2023, two-thirds of nonprofits nationwide received government funding, with Arizona nonprofits slightly below the national average in grants and contracts. While 59% of Arizona nonprofits received grants, 21% of their revenue came from government sources, which is lower than the national average of 25%. Read the analysis below to learn more.
About
In 2024, The Center on Nonprofits and Philanthropy at The Urban Institute conducted the National Survey of Nonprofit Trends and Impacts. This survey examined various aspects of nonprofit organizations, including their programs and services, staffing and volunteer involvement, fundraising efforts, donations and finances, as well as their engagement with government entities.1
This memo compares the data collected from Arizona nonprofits to nonprofits nationwide that received government funding, including grants and contracts.
In 2023, two-thirds of the nonprofits surveyed received at least one government grant or contract.2 Figure 1 shows that Arizona nonprofits received slightly less government funding in 2023 than the national representation.
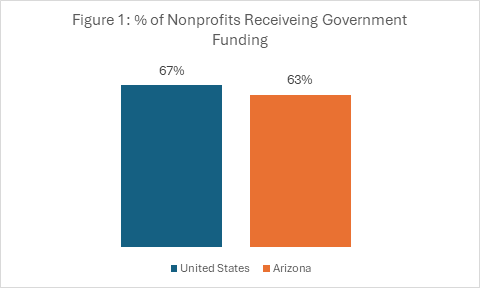
Source: 2024 National Survey of Nonprofit Trends and Impacts, Urban Institute
Note: 3,283 respondents answered the questions used to produce the United States data in this table.
Government Grants and Contracts
Grants
In 2023, 59% of nonprofits in Arizona received local, state, or federal grants, which was 4% less than the national representation. Figure 2 shows that the most common grants received by Arizona nonprofits were local grants, similar to the national representation of nonprofits.
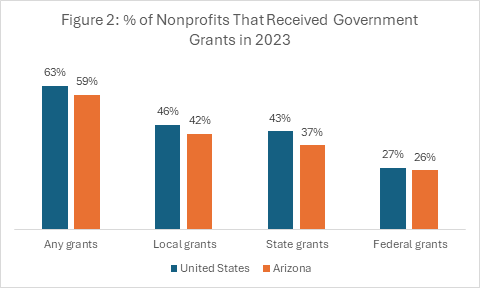
Source: 2024 National Survey of Nonprofit Trends and Impacts, Urban Institute
Note:3,283 respondents answered the questions used to produce the United States data in this table.
Contracts
In Arizona, less than one-fifth of the nonprofits surveyed received government contracts, slightly lower than the percentage for nonprofits surveyed nationwide. However, a larger portion of Arizona nonprofits obtained state and federal contracts than the national percentages.
Figure 3 shows that Arizona’s nonprofits received most government contracts from the state (16%), while the national percentage was 12%. The percentage of local contracts for Arizona nonprofits was the same as the national figure, at 14%. Additionally, 8% of Arizona nonprofits received federal contracts, compared to just 6% for nonprofits nationwide.
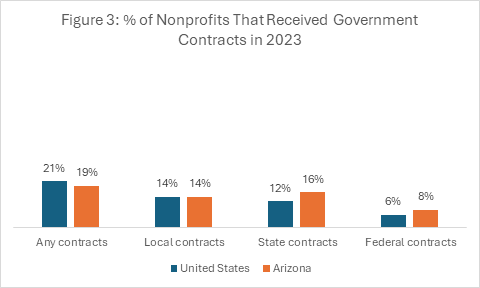
Source: 2024 National Survey of Nonprofit Trends and Impacts, Urban Institute
Note: 3,283 respondents answered the questions used to produce the United States data in this table.
Percent Of Revenue Received from Government Sources
Nonprofits in Arizona, on average, receive 21% of their revenue from government sources, which is slightly lower than the national average of 25%. Figure 4 illustrates the percentage of revenue nonprofits received from government sources, categorized by quartile. 70% of Arizona nonprofits received 25% or less of their revenue from government sources.
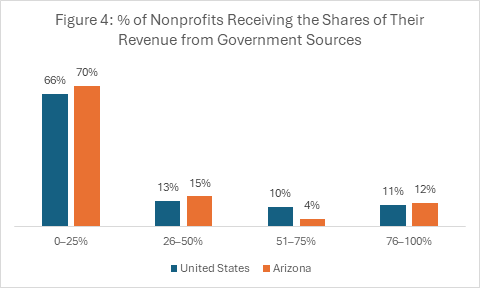
Source: 2024 National Survey of Nonprofit Trends and Impacts, Urban Institute
Note: 2,539 respondents answered the question used to produce the United States data in this table.